
Contact
Any inquiries about your nanoparticle/RNA-LNP formulation?
Drop us a line!
Loading specific message...

Contact
Any inquiries about your nanoparticle/RNA-LNP formulation?
Drop us a line!
Loading specific message...
Book a demo
Tell us about your nanoparticle or RNA-LNP project and request a TAMARA demonstration.
Our team will get back to you shortly to schedule your session.
Loading specific message...
Introduction
The Quant-iT™ RiboGreen™ RNA assay (1) is a highly sensitive fluorescence-based method for RNA quantification. In the context of lipid nanoparticles (LNPs), it is commonly used to determine encapsulation efficiency (EE%) by distinguishing between free (unencapsulated) RNA and total RNA following nanoparticle disruption.
RiboGreen is a fluorescent dye that selectively binds to RNA, generating a signal proportional to RNA concentration. By measuring fluorescence before and after LNP lysis using a detergent (e.g., Triton X-100), it is possible to quantify:
• Free RNA (accessible before lysis)
• Total RNA (after LNP disruption)
Encapsulation efficiency is then calculated as the proportion of RNA encapsulated within nanoparticles (Fig. 1).

The RiboGreen assay is widely used in laboratories due to its simplicity and compatibility with standard fluorescence microplate readers, making it well suited for routine characterization of RNA-loaded nanoparticles. It offers high sensitivity, enabling detection of low RNA concentrations across a broad dynamic range. However, accurate quantification requires careful control of experimental conditions, as fluorescence signals may be influenced by the sample environment, dilution, and measurement settings.
Key definitions & calculations
Encapsulation efficiency (EE%) reflects the proportion of RNA successfully encapsulated within nanoparticles and is a key indicator of formulation quality.
| (Eq.1) |
Encapsulation yield (EY%) represents the overall process efficiency. It may reflect potential losses occurring during formulation alone, or across both formulation and downstream processing steps, depending on the stage at which the measurement is performed.
| (Eq.2) |
In Eq.2, RNA input corresponds to the RNA concentration measured from the initial aqueous RNA solution used for formulation.
RNA loading describes the amount of RNA associated with the nanoparticle relative to lipid content and is relevant for dosing considerations. It can be expressed as weight percentage (wt%) or as µg RNA per mg of LNP.
| (Eq.3) |
Materials
Table 1. List of equipment, reagents, and consumables required for EE% analysis using RiboGreen assay.
| Category | Materials |
|---|---|
| Equipment | ● Fluorescence microplate reader (e.g., TECAN) ● Pipettes |
| Reagents | ● Quant-iT™ RiboGreen™ RNA Reagent ● TE buffer (10 mM Tris-HCl, 1 mM EDTA, pH 7.5) ● Nuclease-free water ● RNA standard ● Detergent (e.g., Triton X-100, 10% v/v in nuclease-free water) |
| Consumables | ● 96-well black microplate ● Nuclease-free tubes and pipette tips ● Plate cover (optional) |
Protocol for EE% analysis of RNA-LNPs using RiboGreen
1. Preparation of reagents & solutions
1.1. Preparation of TE buffer
- Prepare 1X TE buffer (10 mM Tris-HCl, 1 mM EDTA, pH 7.5) by diluting the provided 20X stock solution 20-fold with nuclease-free water.
Note (!): Ensure all solutions are RNase-free to prevent RNA degradation.
- Use 1X TE buffer for:
- Preparation of RiboGreen working solution
- Dilution of RNA standards
- Dilution of samples
1.2. Preparation of RiboGreen working solution (high-range assay)
- Allow the RiboGreen reagent to equilibrate to room temperature before opening.
- Prepare a 200-fold dilution in TE buffer (high-range assay, 20 ng/mL – 1 µg/mL RNA). Mix gently and protect the solution from light.
- e.g., 50 µL RiboGreen + 9.95 mL TE buffer for ~100 samples
Notes (!):
- Prepare fresh and use within a few hours.
- Use polypropylene tubes; avoid glass containers (adsorption effects).
- Keep the reagent protected from light to prevent photodegradation.
- Based on prior internal studies, the high-range RiboGreen assay was selected for this protocol, as it provides optimal sensitivity and compatibility with RNA concentrations typically obtained in standard RNA-LNP formulations prepared using the TAMARA platform in our laboratory. (3)
1.3. Preparation of RNA stock solution
- Prepare a 2 µg/mL RNA solution in TE buffer using RNase-free consumables.
Notes (!):
- We recommend preparing the standard curve using the same RNA type and sequence as the one encapsulated in the LNPs, rather than using the RNA standard provided in the assay kit. This ensures more representative fluorescence behavior and improves the accuracy of quantification.
- The RNA standard solution should be prepared in the same buffer conditions as the samples to ensure accurate comparison.
1.4. Pre-dilution of RNA samples
- Prior to plate setup, dilute RNA-LNP samples and RNA input solutions 1:20 in TE buffer.
Notes (!):
- Following plate preparation (20 µL pre-diluted sample + 80 µL TE buffer + 100 µL RiboGreen), the final dilution factor reaches 1:200 relative to the initial sample concentration. This dilution must be taken into account during data analysis and when back-calculating RNA concentrations.
- The pre-dilution step is required to ensure that the final RNA concentrations fall within the linear range of the high-range RiboGreen assay. The pre-dilution factor may be adjusted if necessary depending on the RNA concentration of the formulation.
2. Plate setup & pipetting workflow
2.1. Deposition of RNA standards (high-range assay)
- Dispense the appropriate volumes of RNA standard solution (2 µg/mL) into the designated wells according to Table 1. Prepare standards in triplicate across each row (e.g., A1–A3, B1–B3, etc.).
Table 2. Preparation of high-range RNA standard curve.
| Well position | Volume of 2 µg/mL RNA solution (µL) | Volume of TE buffer (µL) | Volume of RiboGreen (µL) | Final RNA concentration (µg/mL) |
|---|---|---|---|---|
| A1–A3 | 100 | 0 | 100 | 1 |
| B1–B3 | 50 | 50 | 100 | 0.5 |
| C1–C3 | 20 | 80 | 100 | 0.2 |
| D1–D3 | 10 | 90 | 100 | 0.1 |
| E1–E3 | 5 | 95 | 100 | 0.05 |
| F1–F3 | 2 | 98 | 100 | 0.02 |
| G1–G3 | 100 | 0 | 100 | 0 |
Note (!): The high-range assay is used in this protocol for standard curve preparation. For samples with lower RNA concentrations, the low-range assay may be used as an alternative. For low-range assay conditions, please refer to the Quant-iT™ RiboGreen™ RNA Reagent and Kit user guide (1).
2.2. Deposition of RNA-LNP samples
- Add 20 µL of each pre-diluted RNA-LNP sample (see Section 1.4) into the designated wells. Perform all measurements in triplicate.
Notes (!):
- Samples are loaded such that a final pre-dye volume of 100 µL per well is reached after TE addition (see Section 2.3). Under the conditions described in this protocol, samples are typically diluted to reach a final RNA concentration of ~0.1 µg/mL in the assay well, corresponding to the mid-range of the high-range standard curve for optimal accuracy. A typical approach for standard RNA-LNP formulations (e.g., SM-102, ALC-0315, LP-01) prepared using the Inside Therapeutics RNA-LNP Formulation Protocol with TAMARA (3) is to load 20 µL of sample and add 80 µL of TE buffer per well.
- The sample volume may be adjusted if necessary, provided that the final pre-dye volume remains constant (100 µL). Higher dilution factors may help reduce the influence of interfering contaminants; however, very small sample volumes should be avoided due to reduced pipetting accuracy. (1)
- (Optional) For encapsulation yield (EY%) determination, include the input RNA solution used during microfluidic mixing in the plate. Load this solution into wells H1–H3 using the same conditions as samples (e.g., 20 µL of pre-diluted input RNA solution).
2.3. Deposition of TE buffer
- Add TE buffer to each well to reach a final pre-dye volume of 100 µL:
- For standards: complete according to Table 2
- For samples: add 80 µL of TE buffer to wells containing 20 µL of sample
2.4. Deposition of RiboGreen reagent
- Add 100 µL of RiboGreen working solution to all wells (standards & samples). Ensure the plate is protected from light.
3. Fluorescence measurement – Free RNA
- Place the microplate in the fluorescence plate reader. Set the instrument parameters as follows:
- Temperature: 25ºC
- Shaking: Brief mixing prior to reading (e.g., 30 seconds, linear shaking)
- Fluorescence intensity:
- Excitation wavelength: 485 nm
- Emission wavelength: 530 nm
- Measure fluorescence intensity for all wells.
- This first measurement corresponds to free (unencapsulated) RNA present outside the LNPs.
Notes (!):
- Set the instrument gain so that the wells with the highest RNA concentration produce fluorescence signals close to the maximum detection limit of the microplate reader.
- Ensure that all fluorescence values fall within the linear range of the standard curve for accurate quantification.
- Keep measurement timing consistent and minimize exposure to light to reduce photobleaching effects.
Add 100 µL of RiboGreen working solution to all wells (standards & samples). Ensure the plate is protected from light.
4. LNP disruption & Total RNA measurement
4.1. Addition of detergent (LNP lysis)
- Add 10 µL of Triton X-100 (10% v/v) to each well (standards & samples).
- Mix well to ensure homogeneous distribution of the detergent.
Note (!): Gentle pipette mixing during Triton X-100 addition can improve homogenization. However, avoid vigorous mixing to prevent the formation of bubbles, which may interfere with fluorescence measurements.
4.2. Incubation
- Place the plate in the microplate reader and incubate for 25 minutes at 25°C with regular shaking (30 s shaking followed by 4 min 30 s rest) to ensure complete disruption of the LNPs and full release of encapsulated RNA.
Note (!):
- Ensure sufficient mixing during incubation to promote efficient LNP lysis.
- Incomplete lysis may lead to underestimation of total RNA and inaccurate EE% values.
4.3. Fluorescence measurement – Total RNA
- Measure fluorescence again using the same instrument settings as in Step 11.
- This second measurement corresponds to total RNA (free + encapsulated).
5. Data analysis
5.1. Background correction
- Subtract the fluorescence signal of the blank (no RNA) from all wells.
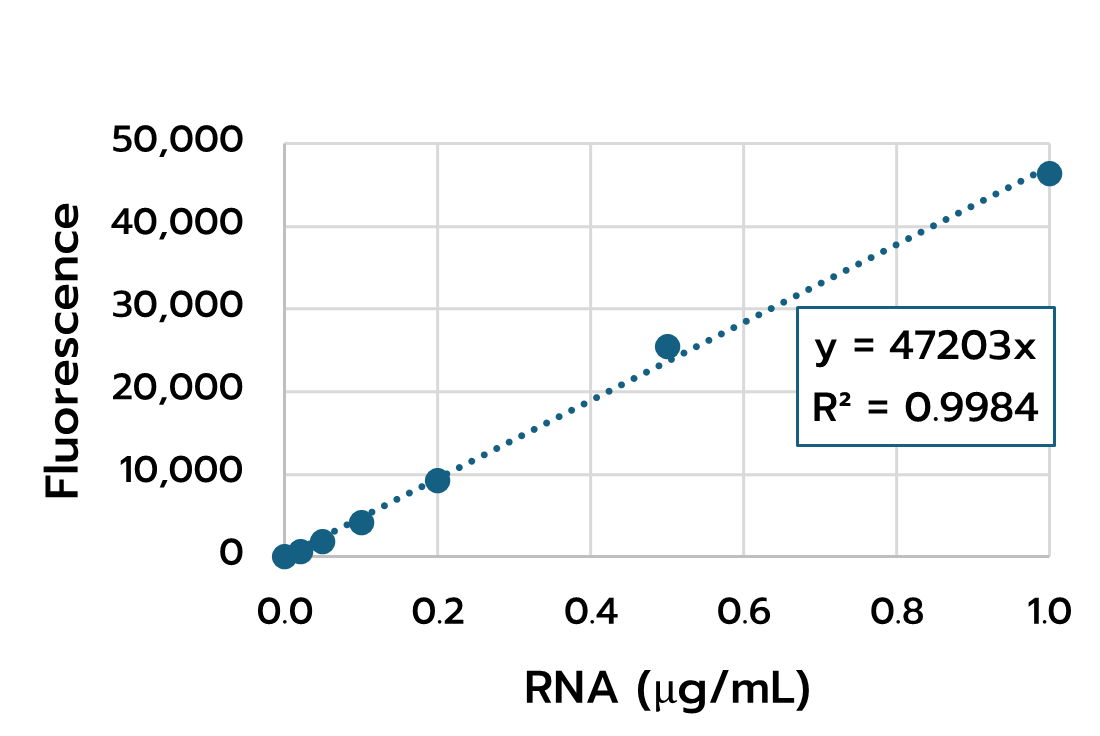
5.2. Standard curve generation
- Plot the corrected fluorescence values of the RNA standards versus their concentration. Generate a calibration curve (linear regression).
Notes (!):
- Only use data points within the linear range of the assay.
- The coefficient of determination (R²) should be close to 1 for reliable quantification.
5.3. Determination of RNA concentrations
- Use the standard curve to calculate RNA concentrations for:
- Free RNA (before Triton addition)
- Total RNA (after Triton addition)
5.4. Encapsulation efficiency (EE%) and yield (EY%) calculation
- Calculate encapsulation efficiency using Eq.1.
Notes (!):
- EE% is calculated from measurements performed on the same sample.
- EE% values may vary depending on the stage at which they are measured (e.g., before or after purification), due to potential changes in LNP integrity or RNA release.
- (Optional) If RNA input solution was included in the plate, calculate encapsulation yield using Eq.2.
Notes (!):
- Correct for dilution factors when comparing RNA input and RNA-LNP samples, especially if different dilutions were applied during plate preparation.
- Take into account the flow rate ratio (FRR) used during microfluidic mixing, as it directly affects the final RNA concentration in the RNA-LNP samples.
- EY% may vary depending on the stage at which it is measured (e.g., before or after purification steps such as dialysis or ultrafiltration).
5.5. Data processing tools
- For streamlined analysis, Inside Therapeutics provides an Excel-based calculation tool that allows:
- EE% and EY% calculations
- Integration of dilution factors and FRR
- Standardized data processing across experiments
6. Quality control & troubleshooting
- Signal range: Ensure sample fluorescence values fall within the standard curve range.
- If signals are too high → increase dilution
- If signals are too low → reduce dilution
- Reproducibility: Perform all measurements in triplicate and check variability between replicates.
- High variability may indicate pipetting errors, incomplete mixing, or inconsistent sample preparation.
- Assay sensitivity: Maintain consistent buffer conditions, sample preparation, measurement parameters across all samples. Small variations in these factors may impact fluorescence intensity and lead to inaccurate quantification.
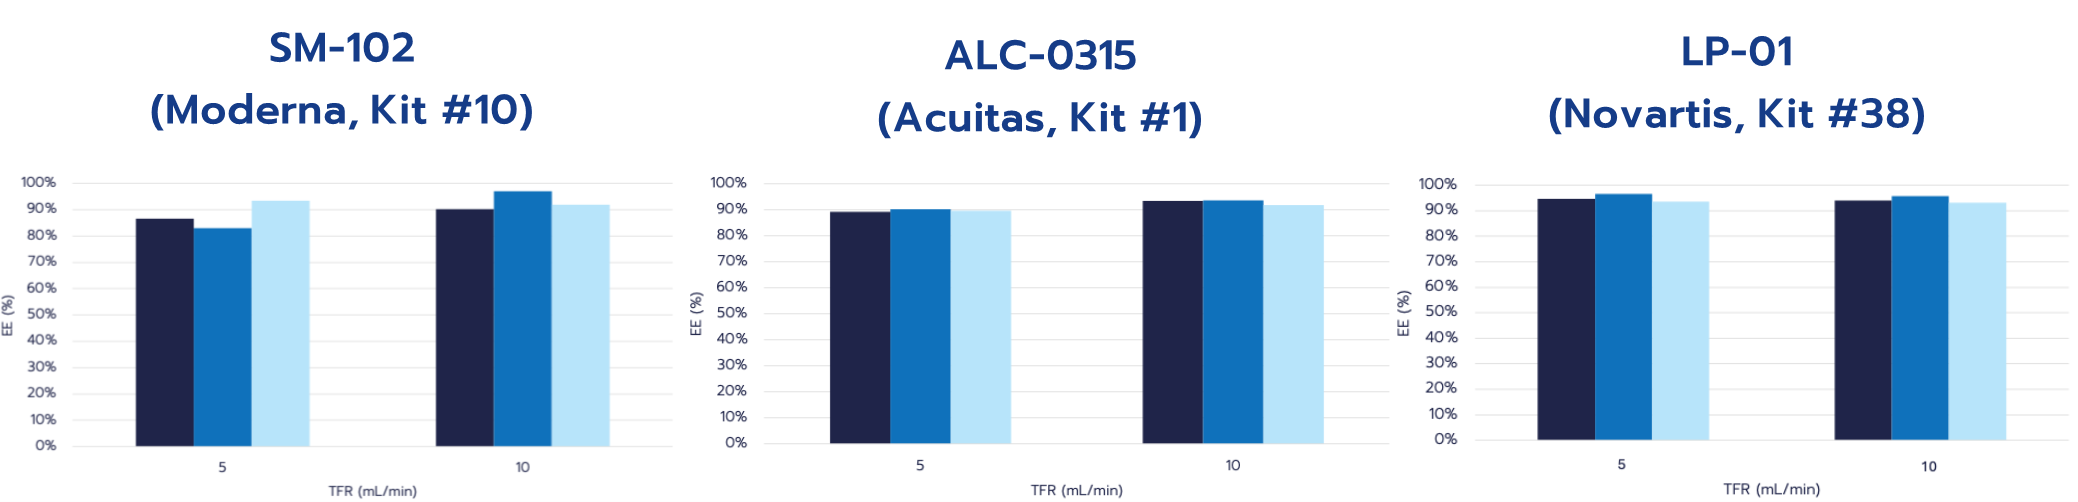
Example EE% Data
Representative encapsulation efficiency (EE%) results for standard RNA-LNP formulations prepared using TAMARA microfluidic platform are shown in Figure 3. Formulations were produced using CordenPharma LNP Starter Kits (SM-102, ALC-0315, and LP-01) at total flow rates (TFR) of 5 and 10 mL/min, at a fixed flow rate ratio (FRR) of 3. Following formulation, samples were purified by dialysis and analyzed using the RiboGreen assay.
Encapsulation efficiencies were consistently high across all tested conditions, with values generally around or above 90% (>80% for all formulations). Comparable EE% values were observed at both flow rates, indicating robust encapsulation performance over the tested processing range.
References
1. Quant-iT TM RiboGreen TM RNA Reagent and Kit [Internet]. [cited 2026 Apr 24]. Available from: https://documents.thermofisher.com/TFS-Assets/LSG/manuals/mp11490.pdf
2. McKenzie RE, Minnell JJ, Ganley M, Painter GF, Draper SL. mRNA Synthesis and Encapsulation in Ionizable Lipid Nanoparticles. Curr Protoc. 2023 Sep 1;3(9). doi:10.1002/cpz1.898 PubMed PMID: 37747354.
3. RNA-LNP Formulation Protocol (SM-102) – Inside Therapeutics [Internet]. [cited 2026 Apr 23]. Available from: https://insidetx.com/resources/protocols/rna-lnp-formulation-protocol-sm-102/

Save the protocol
Download PDF
Looking to get started or improve your LNP formulation screening?
Reach out to us to discover how we can help!
Other Protocols
Looking to learn more about nanoparticles? Do you need inspiration or a different angle to take on your specific problem? Well, we probably have a Review just for you, feel free to check them out!
See all protocols